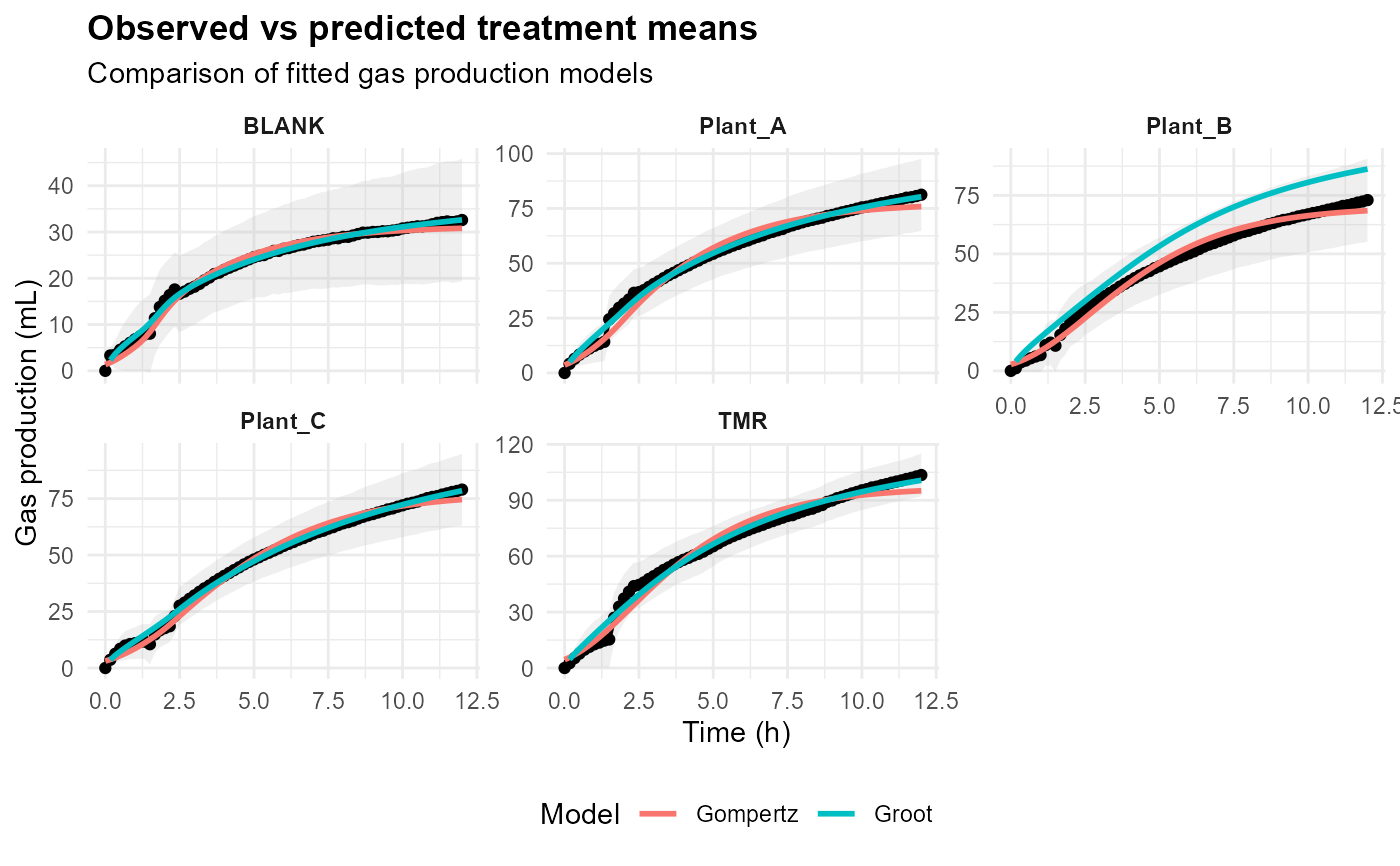
Plot Treatment Means for All Treatments
Source:R/plot_all_treatment_means.R
plot_all_treatment_means.RdCompares observed and predicted treatment means across multiple fitted models.
Details
The observed treatment mean is shown as a black line with optional standard-error bands. Predicted treatment means from each fitted model are overlaid for comparison.
This visualization is useful for evaluating model performance at the treatment level rather than at the individual bottle level.
Examples
files <- example_data()

raw_data <- read_ankom(
  files$ankom
)

metadata <- read_metadata(
  files$metadata
)

gp <- process_ankom(
  raw_data,
  metadata,
  headspace_ml = 210,
  temperature_c = 39
)

groot_fit <- fit_groot(
  gp
)
#> Warning: Large negative pressure values detected. Minimum PSI = -1.274 . Please inspect the affected bottles.
#> rumenGP data validation passed.
#> Observations: 1752
#> Heads: 24
#> Treatments: 5

gompertz_fit <- fit_gompertz(
  gp
)
#> Warning: Large negative pressure values detected. Minimum PSI = -1.274 . Please inspect the affected bottles.
#> rumenGP data validation passed.
#> Observations: 1752
#> Heads: 24
#> Treatments: 5

plot_all_treatment_means(
  Groot = groot_fit,
  Gompertz = gompertz_fit
)