Creates diagnostic histograms for a fitted model.
Details
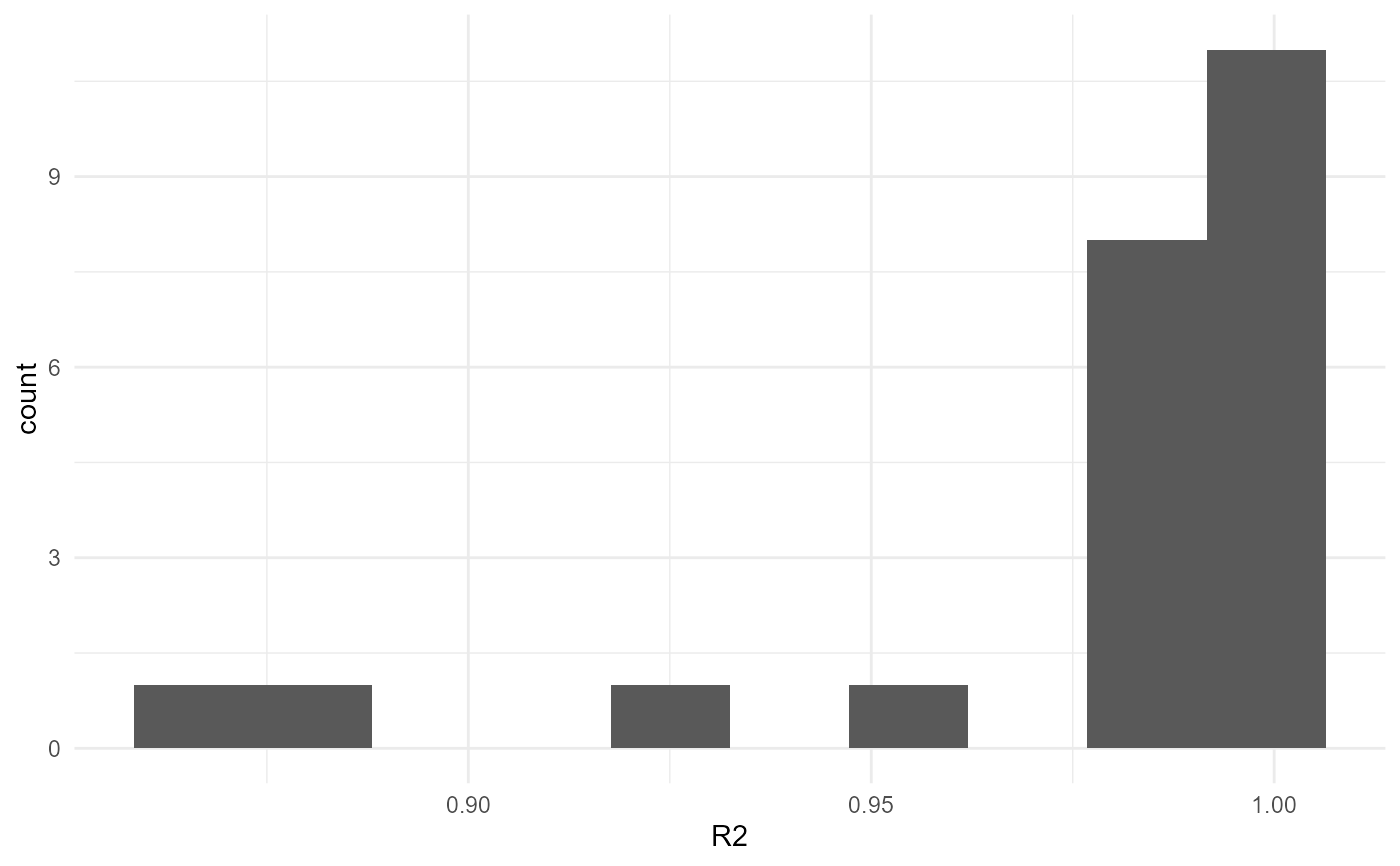
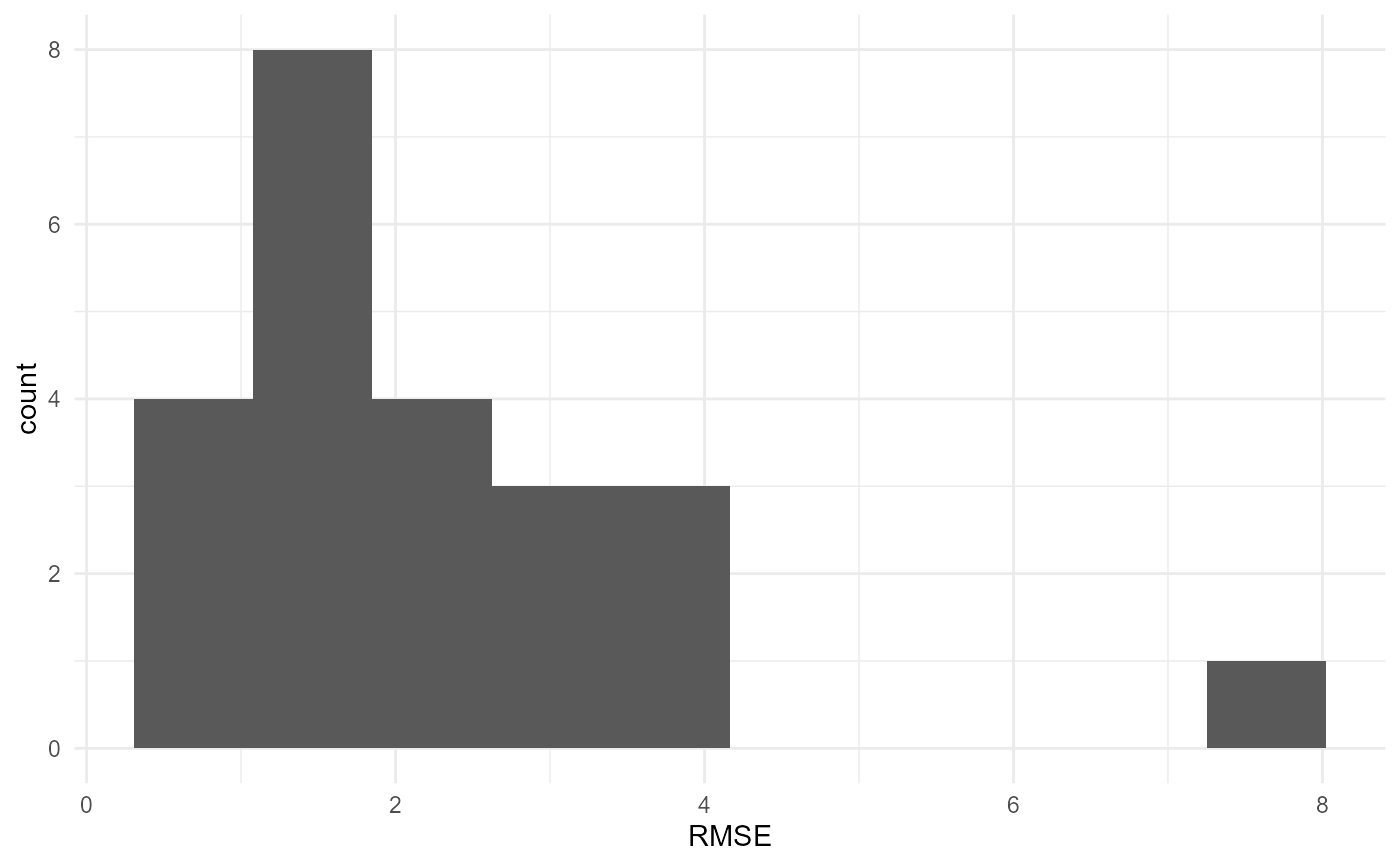
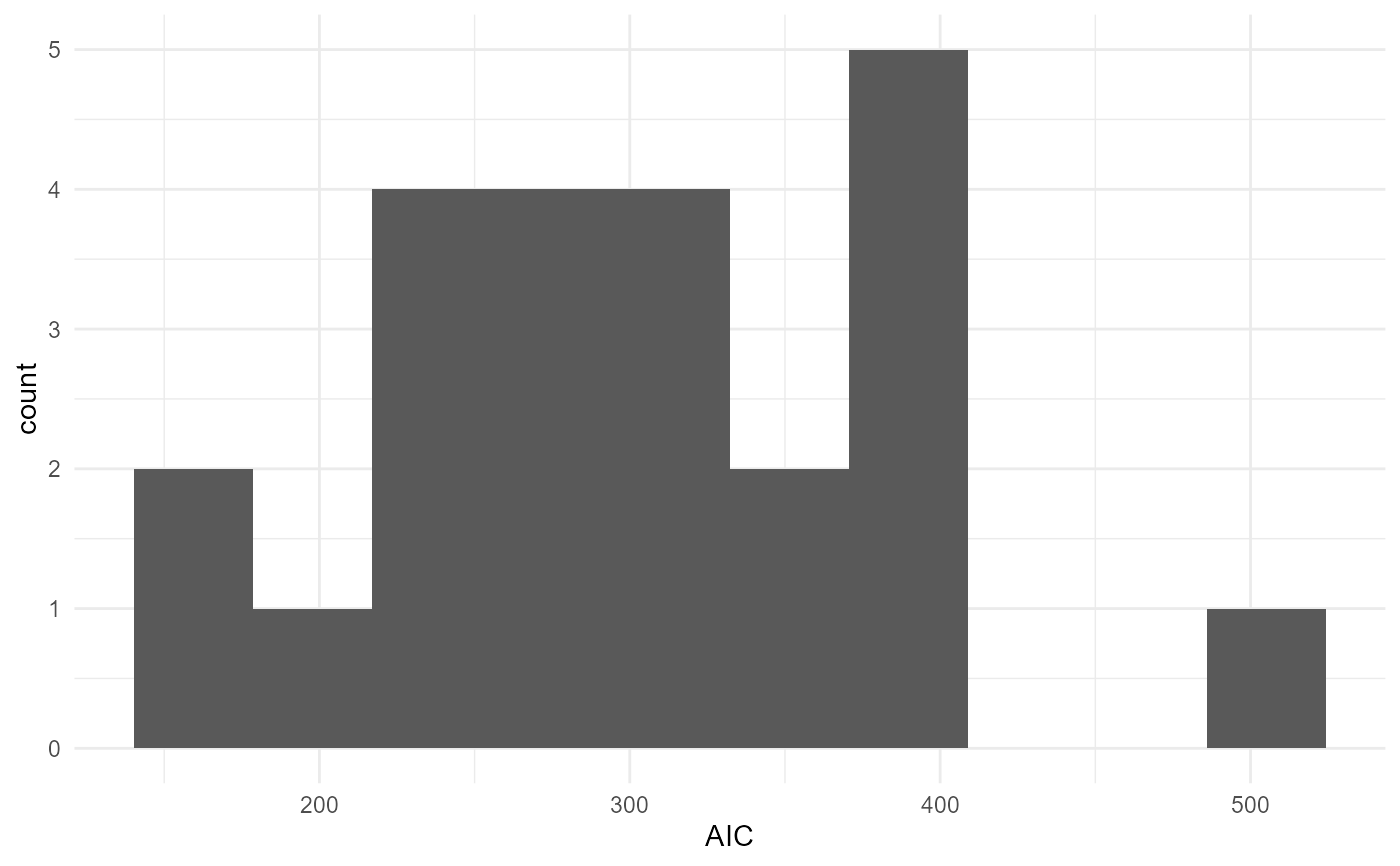
Diagnostic plots can be used to assess:
Residual distributions
Parameter estimates
Model fit quality
Potential outliers
These plots are useful for evaluating whether model assumptions appear reasonable and for identifying problematic fits.
Examples
files <- example_data()
raw_data <- read_ankom(
files$ankom
)
metadata <- read_metadata(
files$metadata
)
gp <- process_ankom(
raw_data,
metadata,
headspace_ml = 210,
temperature_c = 39
)
fit <- fit_groot(
gp
)
#> Warning: Large negative pressure values detected. Minimum PSI = -1.274 . Please inspect the affected bottles.
#> rumenGP data validation passed.
#> Observations: 1752
#> Heads: 24
#> Treatments: 5
plot_diagnostics(
fit
)
#> $R2
#> Warning: Removed 1 row containing non-finite outside the scale range (`stat_bin()`).
 #>
#> $RMSE
#> Warning: Removed 1 row containing non-finite outside the scale range (`stat_bin()`).
#>
#> $RMSE
#> Warning: Removed 1 row containing non-finite outside the scale range (`stat_bin()`).
 #>
#> $AIC
#> Warning: Removed 1 row containing non-finite outside the scale range (`stat_bin()`).
#>
#> $AIC
#> Warning: Removed 1 row containing non-finite outside the scale range (`stat_bin()`).
 #>
#>