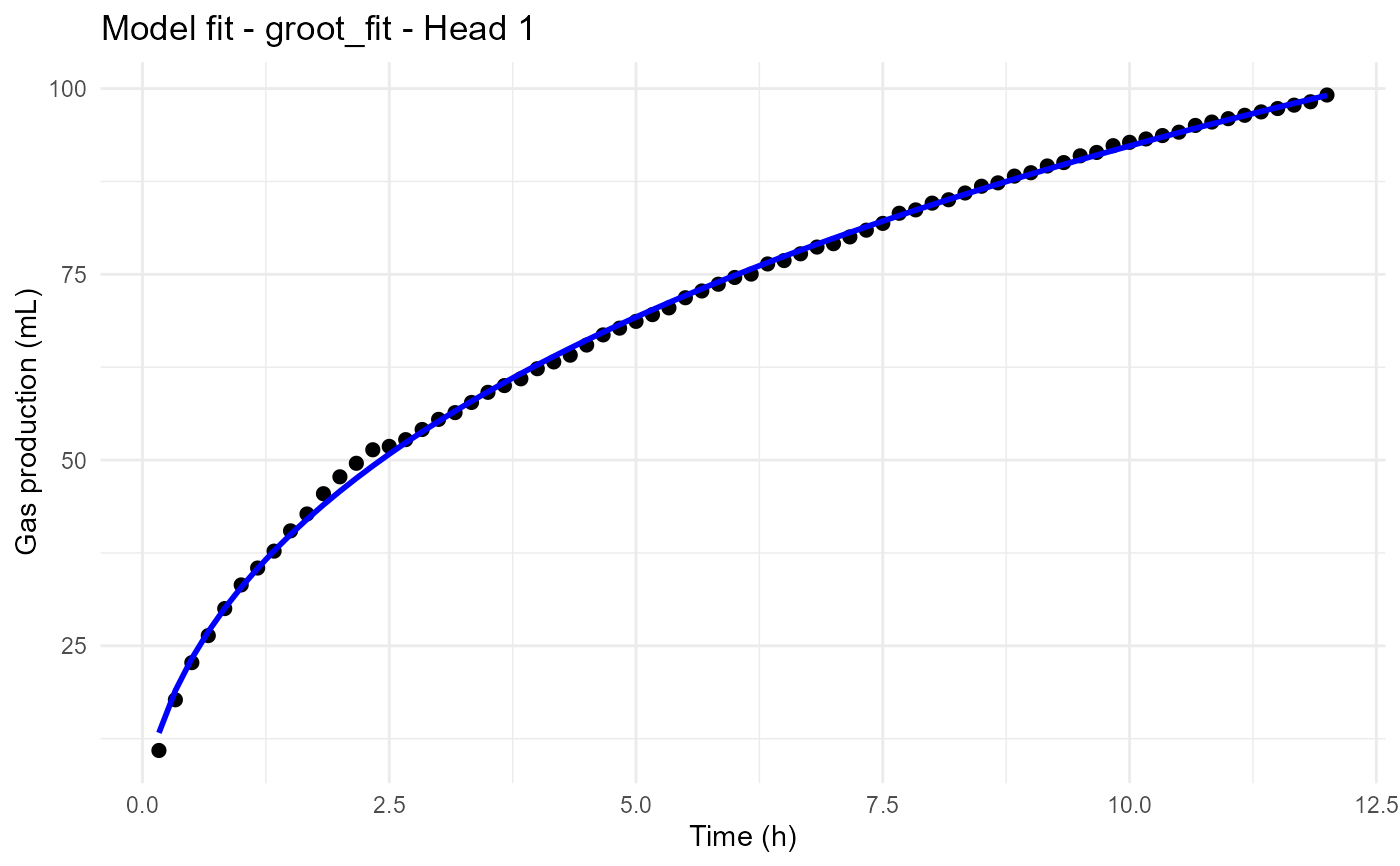
Plots observed and predicted gas production values for an individual bottle.
Details
Observed measurements are displayed alongside the fitted model curve, allowing visual assessment of model performance.
This visualization is useful for:
Evaluating model fit
Identifying systematic deviations
Inspecting individual fermentation profiles
Comparing observed and predicted values
Examples
files <- example_data()

raw_data <- read_ankom(
  files$ankom
)

metadata <- read_metadata(
  files$metadata
)

gp <- process_ankom(
  raw_data,
  metadata,
  headspace_ml = 210,
  temperature_c = 39
)

fit <- fit_groot(
  gp
)
#> Warning: Large negative pressure values detected. Minimum PSI = -1.274 . Please inspect the affected bottles.
#> rumenGP data validation passed.
#> Observations: 1752
#> Heads: 24
#> Treatments: 5

# Plot a specific bottle
plot_fit(
  fit,
  head = 1
)