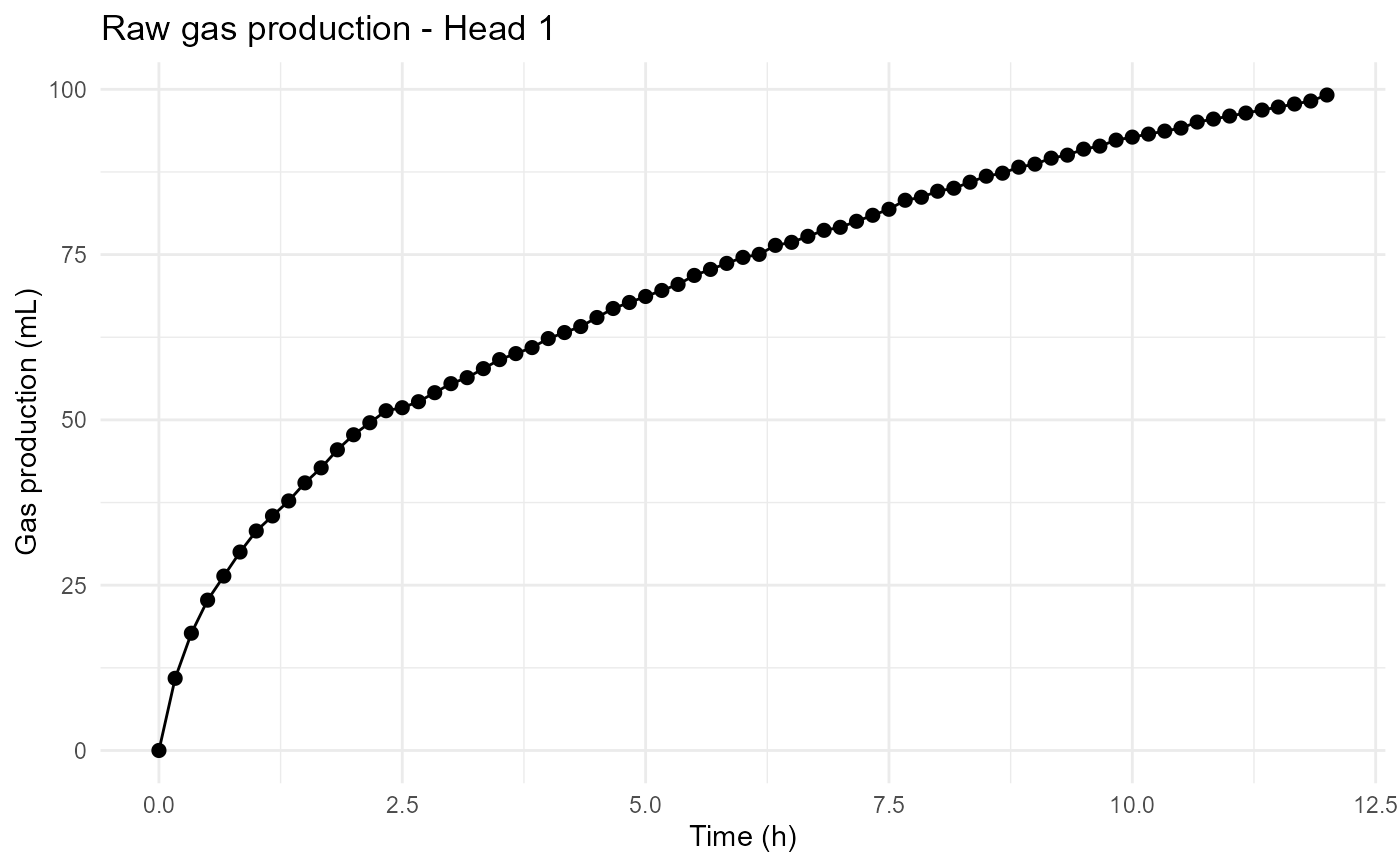
Plots observed gas production measurements for an individual bottle.
Details
This visualization displays the raw gas production profile prior to model fitting and is useful for:
Inspecting fermentation dynamics
Identifying unusual observations
Evaluating data quality
Comparing individual bottle profiles
Examples
files <- example_data()

raw_data <- read_ankom(
  files$ankom
)

metadata <- read_metadata(
  files$metadata
)

gp <- process_ankom(
  raw_data,
  metadata,
  headspace_ml = 210,
  temperature_c = 39
)

plot_gp(
  gp,
  head = 1
)