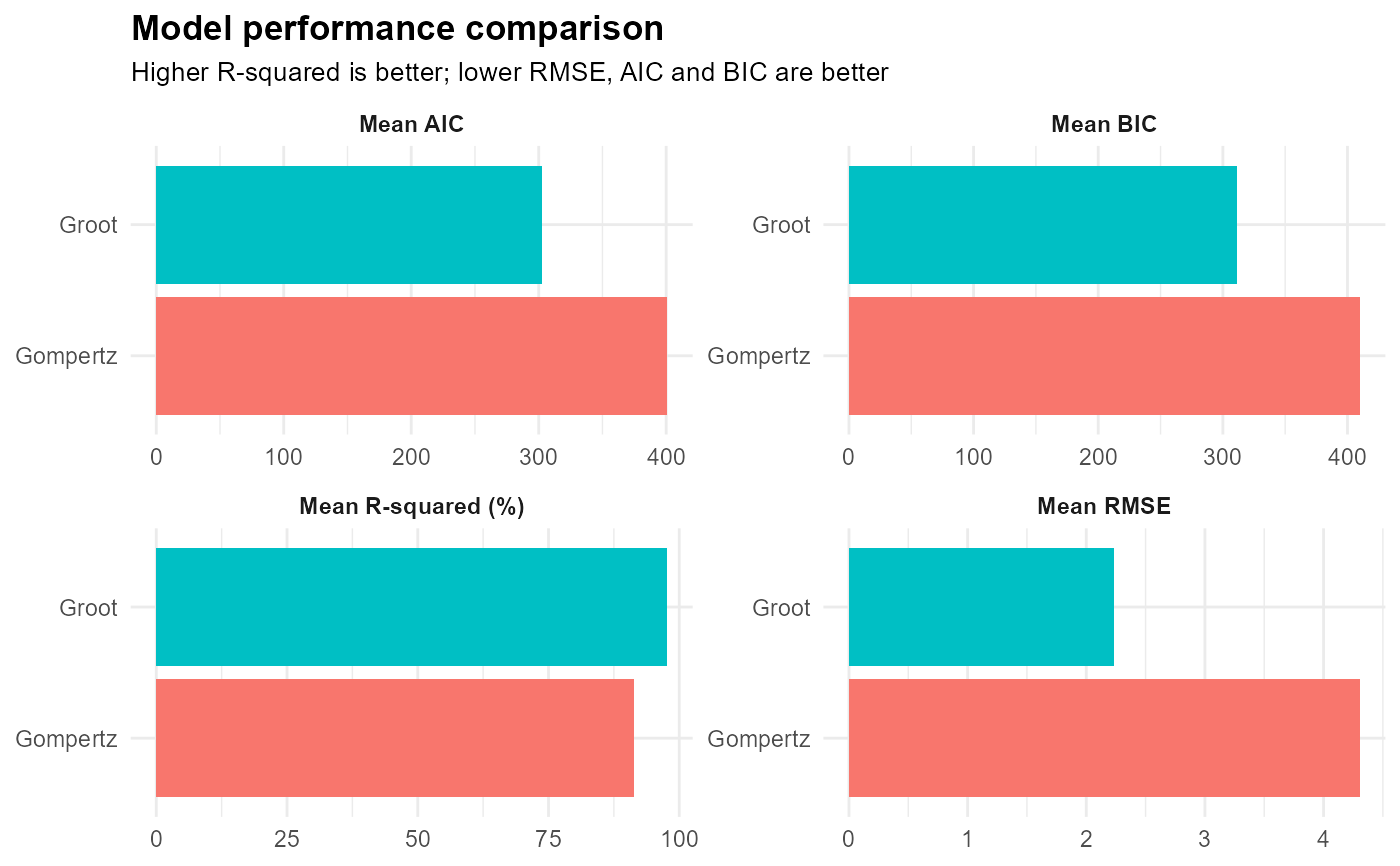
Visualizes model performance metrics produced by
compare_models().
Arguments
- comparison
Output from
compare_models().
Details
This plot provides a graphical comparison of competing models using goodness-of-fit statistics.
Typical metrics include:
R-squared (R²)
Root Mean Squared Error (RMSE)
Residual Sum of Squares (RSS)
Akaike Information Criterion (AIC)
Bayesian Information Criterion (BIC)
The visualization helps identify models that balance goodness of fit and model complexity.
Examples
files <- example_data()

raw_data <- read_ankom(
  files$ankom
)

metadata <- read_metadata(
  files$metadata
)

gp <- process_ankom(
  raw_data,
  metadata,
  headspace_ml = 210,
  temperature_c = 39
)

groot_fit <- fit_groot(
  gp
)
#> Warning: Large negative pressure values detected. Minimum PSI = -1.274 . Please inspect the affected bottles.
#> rumenGP data validation passed.
#> Observations: 1752
#> Heads: 24
#> Treatments: 5

gompertz_fit <- fit_gompertz(
  gp
)
#> Warning: Large negative pressure values detected. Minimum PSI = -1.274 . Please inspect the affected bottles.
#> rumenGP data validation passed.
#> Observations: 1752
#> Heads: 24
#> Treatments: 5

comparison <- compare_models(
  Groot = groot_fit,
  Gompertz = gompertz_fit
)

plot_model_performance(
  comparison
)