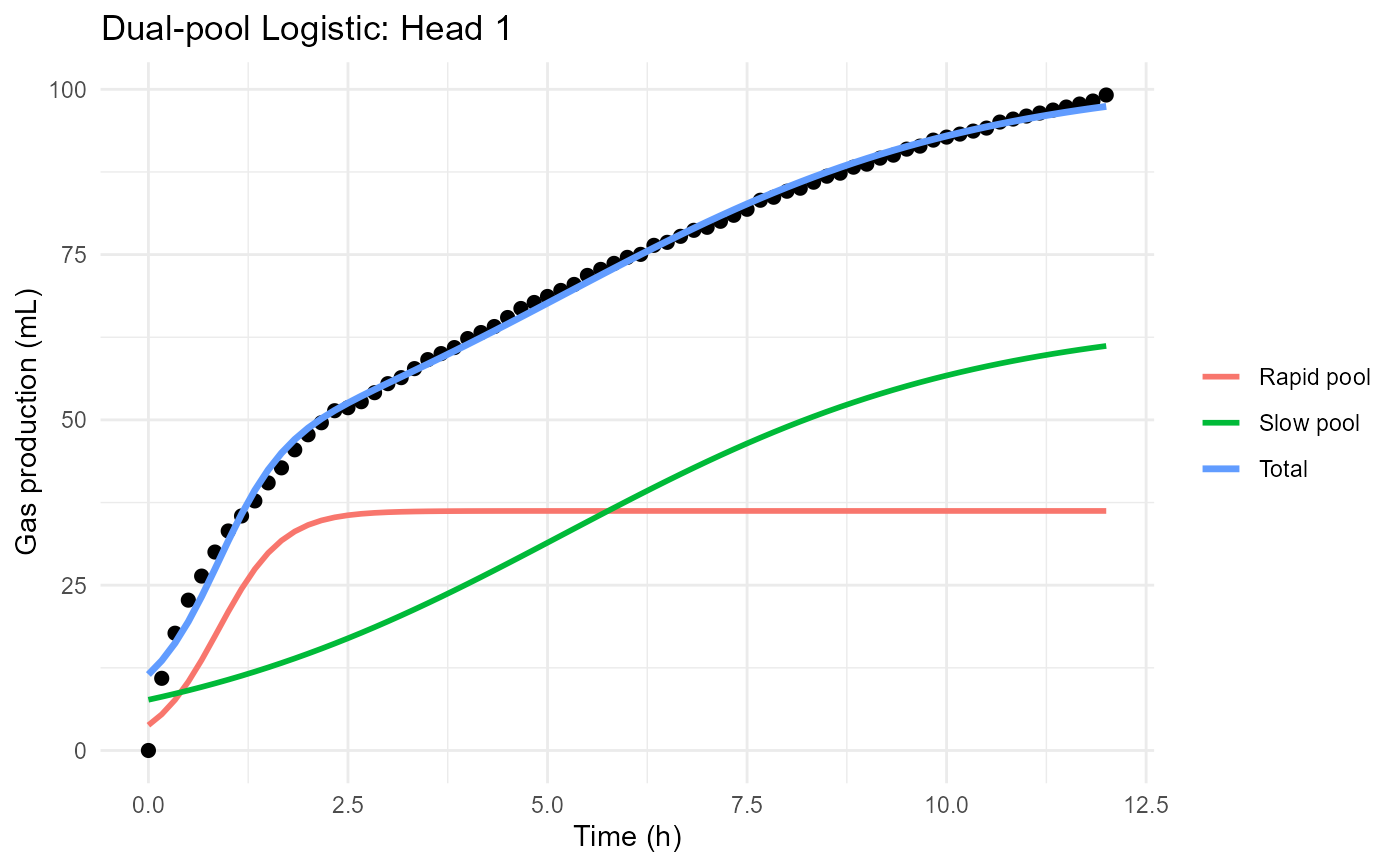
Visualizes the rapid pool, slow pool, total predicted gas production, and observed gas production for a fitted dual-pool logistic model.
Details
The plot helps interpret the relative contributions of rapidly and slowly fermentable fractions through time.
Components displayed include:
Observed gas production
Predicted total gas production
Rapid fermentation pool
Slow fermentation pool
This visualization is useful for understanding substrate heterogeneity and fermentation dynamics.
Examples
files <- example_data()

raw_data <- read_ankom(
  files$ankom
)

metadata <- read_metadata(
  files$metadata
)

gp <- process_ankom(
  raw_data,
  metadata,
  headspace_ml = 210,
  temperature_c = 39
)

fit <- fit_dual_logistic(
  gp
)
#> Warning: Large negative pressure values detected. Minimum PSI = -1.274 . Please inspect the affected bottles.
#> rumenGP data validation passed.
#> Observations: 1752
#> Heads: 24
#> Treatments: 5

plot_dual_pools(
  fit,
  head = 1
)