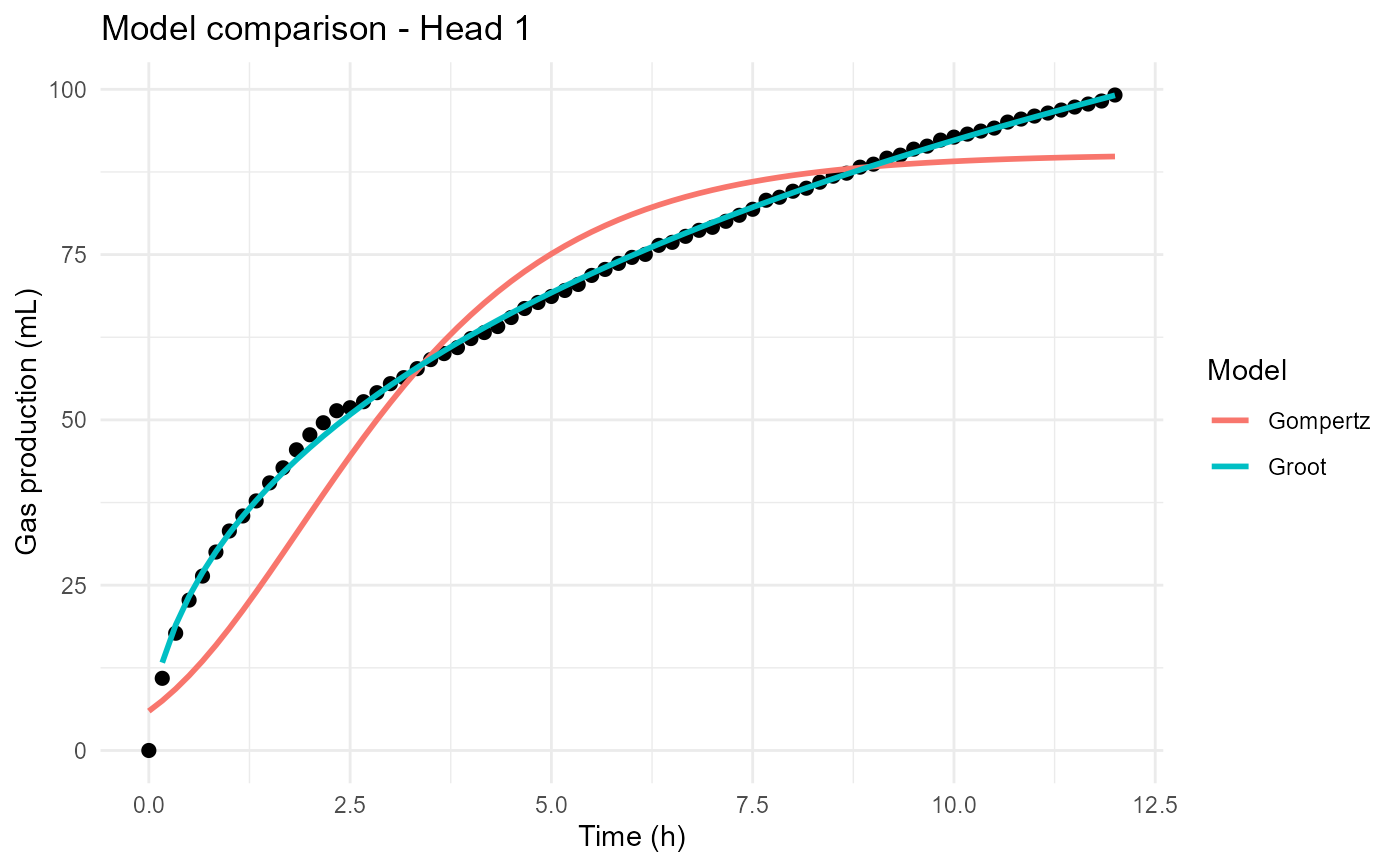
Displays observed gas production values together with predictions from multiple fitted models for a single bottle.
Details
This visualization is useful for:
Comparing competing kinetic models
Evaluating model performance
Identifying differences among fitted curves
Assessing model agreement with observations
Observed measurements are displayed alongside predictions from each supplied model, allowing direct visual comparison.
Examples
files <- example_data()

raw_data <- read_ankom(
  files$ankom
)

metadata <- read_metadata(
  files$metadata
)

gp <- process_ankom(
  raw_data,
  metadata,
  headspace_ml = 210,
  temperature_c = 39
)

groot_fit <- fit_groot(
  gp
)
#> Warning: Large negative pressure values detected. Minimum PSI = -1.274 . Please inspect the affected bottles.
#> rumenGP data validation passed.
#> Observations: 1752
#> Heads: 24
#> Treatments: 5

gompertz_fit <- fit_gompertz(
  gp
)
#> Warning: Large negative pressure values detected. Minimum PSI = -1.274 . Please inspect the affected bottles.
#> rumenGP data validation passed.
#> Observations: 1752
#> Heads: 24
#> Treatments: 5

plot_model_comparison(
  Groot = groot_fit,
  Gompertz = gompertz_fit,
  head = 1
)