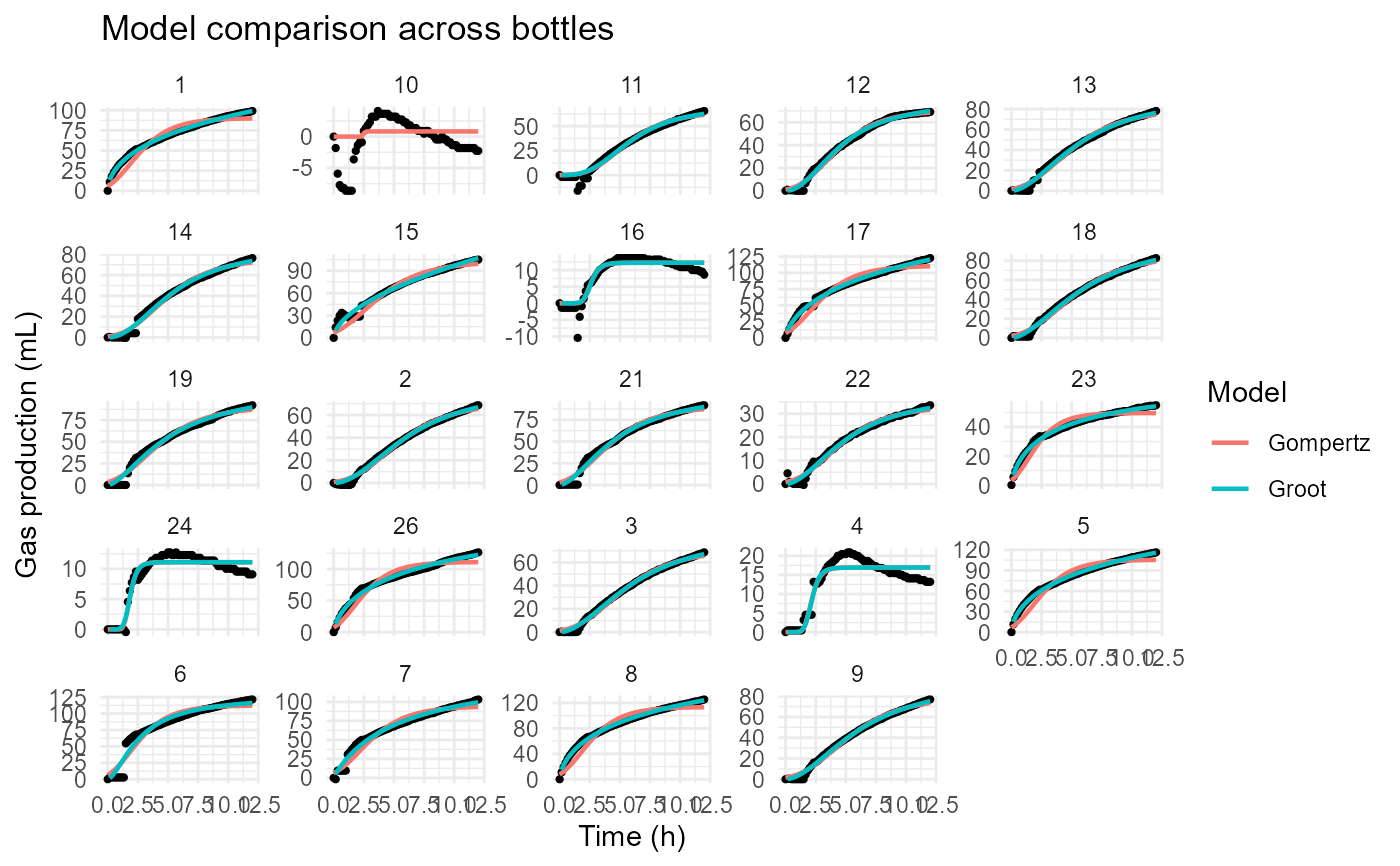
Displays observed and predicted gas production values for multiple fitted models across all bottles.
Details
Observed values are shown alongside model predictions, allowing visual comparison of competing kinetic models across the entire dataset.
This visualization is useful for:
Comparing model performance
Evaluating agreement between models
Identifying systematic deviations
Exploring treatment responses
Examples
files <- example_data()

raw_data <- read_ankom(
  files$ankom
)

metadata <- read_metadata(
  files$metadata
)

gp <- process_ankom(
  raw_data,
  metadata,
  headspace_ml = 210,
  temperature_c = 39
)

groot_fit <- fit_groot(
  gp
)
#> Warning: Large negative pressure values detected. Minimum PSI = -1.274 . Please inspect the affected bottles.
#> rumenGP data validation passed.
#> Observations: 1752
#> Heads: 24
#> Treatments: 5

gompertz_fit <- fit_gompertz(
  gp
)
#> Warning: Large negative pressure values detected. Minimum PSI = -1.274 . Please inspect the affected bottles.
#> rumenGP data validation passed.
#> Observations: 1752
#> Heads: 24
#> Treatments: 5

plot_model_comparison_all(
  Groot = groot_fit,
  Gompertz = gompertz_fit
)