Compare Models for a Treatment
Source:R/plot_model_comparison_treatment.R
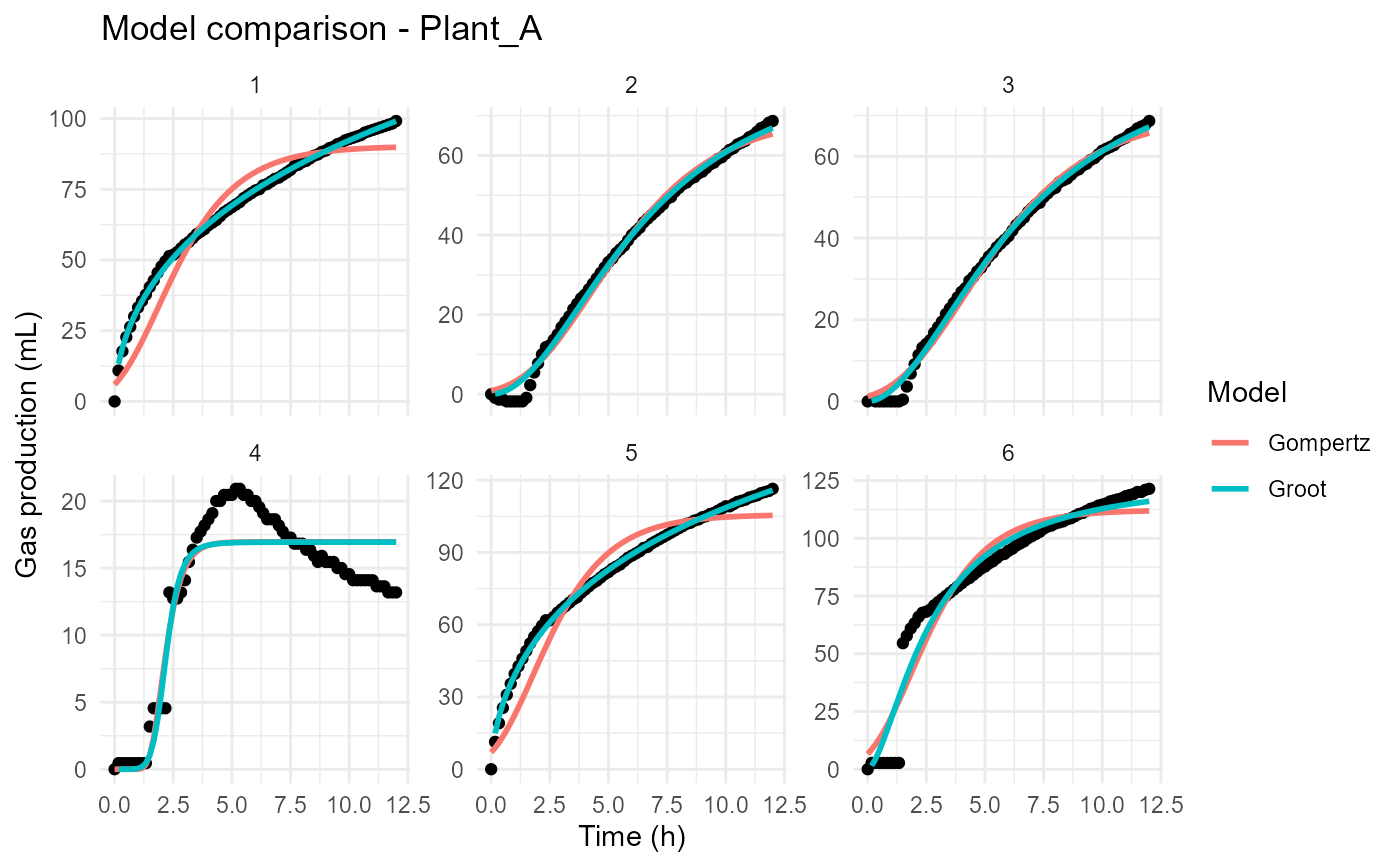
plot_model_comparison_treatment.RdDisplays observed and predicted gas production values for multiple fitted models across all replicates of a selected treatment.
Details
Observed measurements are displayed alongside model predictions, allowing visual comparison of competing kinetic models within a treatment.
This visualization is useful for:
Comparing competing models
Evaluating model performance by treatment
Assessing agreement among biological replicates
Identifying systematic prediction errors
Examples
files <- example_data()

raw_data <- read_ankom(
  files$ankom
)

metadata <- read_metadata(
  files$metadata
)

gp <- process_ankom(
  raw_data,
  metadata,
  headspace_ml = 210,
  temperature_c = 39
)

groot_fit <- fit_groot(
  gp
)
#> Warning: Large negative pressure values detected. Minimum PSI = -1.274 . Please inspect the affected bottles.
#> rumenGP data validation passed.
#> Observations: 1752
#> Heads: 24
#> Treatments: 5

gompertz_fit <- fit_gompertz(
  gp
)
#> Warning: Large negative pressure values detected. Minimum PSI = -1.274 . Please inspect the affected bottles.
#> rumenGP data validation passed.
#> Observations: 1752
#> Heads: 24
#> Treatments: 5

plot_model_comparison_treatment(
  Groot = groot_fit,
  Gompertz = gompertz_fit,
  treatment = unique(
    gp$Treatment
  )[1]
)